Statistical Data Analysis
Crucial field that involves the collection, processing, and interpretation of numerical data
Contact UsStatistical Data Analysis
Following is a list of statistical techniques that are involved in data analysis.
- Data Sampling
- Central Tendency
- Random Variables
- Probability Distributions
- Statistical Inference
- Confidence Intervals
- Hypothesis Testing
Let us understand each of the statistical techniques in detail.
1. Data Sampling
It is the process of collecting and grouping the data for statistical analysis purposes. It has two categories.
Population:
- It refers to the whole data set for the use case.
- It includes all groups which can be correlated with each other.
- Example: All the members of an online forum reading articles.
Sample:
- It is a subset of the population.
- These are a random sample of data points.
- The process of determining the sample from population data is known as sampling.
- Example: A group of club members sample who read technical articles.
2. Central Tendency
Mean:
- This is the mean or average value of the scoped data.
- It is calculated by adding the data all points followed by dividing the total number of data points.
Median:
- Median is the middle value of data points for an odd number of observations.
- The Median is calculated by averaging two middle numbers if the number of observations is even.
- The observation data is shorted in ascending order to determine the median value.
Mode:
- The mode is calculated based upon the number of repetitions or frequency in the data set.
- The mode can be used for categorical data.
3. Random Variables
Random variables are a special type of the variable used in Statistical Techniques that quantify the outcomes which are generated through random processes. The Random variables are generally noted using upper case letters such as X or E(X) or Y. It is related to the Probability of the process outcomes.
Discrete:
- The discrete values that be counted.
- It can be finite or infinite countable numbers.
- Example: count numbers attendees appear for a conference.
Continuous:
- The continuous values of the variable cannot be counted as discrete values.
- It is the range of values that are continuous in nature.
- For example the height of sportspersons in a football match.
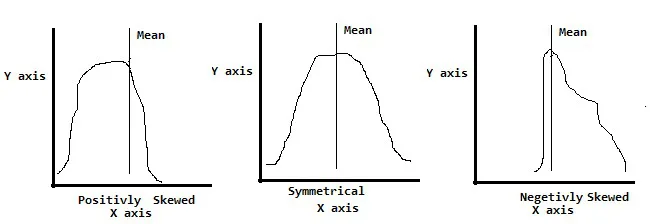
Skewness:
There is another important concept known as skewness, This process determines the coefficient of the skewness of the random variable. It also includes checking the symmetry of data distribution.
The process of checking skewness involves identifying.
- Symmetrical: It implies Mean=Median=Mode
- Positively Skewed: It implies Mean>Median>Mode
- Negatively Skewed: It implies Mean<Median<Mode
Following is a graphical representation of skewness and symmetrical data distribution.
Also, there are two terms regularly used for data analysis for analyzing data distribution or identifying the distance of data points from the mean. These are also known as measures of data spread.
Variance:
- It is a squared deviation of a random variable from the mean.
- Square is used to manage positive and negative signed values.
- Variance is represented as σ2.
Standard Deviation:
- It is the square root value of the variance value.
- The high standard deviation value signifies the data is spread away from the Mean value.
- The low standard deviation values signify the data is spread nearer to the mean value.
- It is represented as a symbol σx Where X is the Random Variable.
4. Probability Distributions
Probability is the process of determining the likelihood of an event that will occur in the future. It works using Numerical values relevant to the process outcomes of the event. Set theory mathematics is the basic fundamentals for probability determinations.
Example of a data set for probability is the flipping of a coin and the outcomes.
- Coin ={0,1}
- Where 0 represents the scenario if the flipped coin turns out to be ‘Head’
- 1 represents the scenario if the flipped coin turns out to be ‘Tail’
All the possible outcomes for an event or observation is known as ‘Sample Space’. The Sample Space contains the elements which equally likely in nature. The Probability of an event can be denoted as P(Event). If we assume the event A with sample spaces then P(A) will be the,
- Likelihood of a particular element in A / Total elements in the sample space for A.
Example: for a Coin Flipping scenario
- P(head) = Likelihood of outcome as head / all possible outcomes of coin flipping
- P(A)= ½
- P(A) =0.5 = 50 %
There are several other concepts involved in probability distributions calculations,
- Union
- It is the union of two data sets
- P(A U B)
- Intersection
- It is an intersection or common element between two data sets
- P(A ∩ B)
- Conditional Probability
- Conditional probability is the calculation of probability for an event while the dependent event has already occurred.
- P (A|B)=P(A ∩ B)/P(B)
- Bayes Theorem
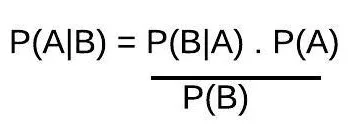
The above formula notations labels:
- A, B are the events
- P(A) is an independent probability of event A
- P(B) is an independent probability of event B
- P(A|B) is the probability of event A assuming event B is true
- P(B|A) is the probability of event B assuming event A is true
5. Statistical Inference
- It is the process of comparing the statistical measures of different data samples to observe the significance of the statistics.
- The population characteristics are known as parameters and the sample characteristics are known as statistics.
6. Confidence Intervals
- It is a range of values in which the population parameter will be situated.
- It helps in measuring the degree of certainty in a sampling process.
- The confidence interval is leveled with 95% or 99% in most scenarios.
7. Hypothesis Testing
It is an important statistical technique for data analysis. Hypothesis testing is an efficient validator of data analysis. A statistical hypothesis is mostly driven by certain assumptions about the data. These hypotheses are based upon true or false assumptions.
- Hypothesis testing generally starts with the null hypothesis.
- The null hypothesis assumes the statement to be true unless proven otherwise.
- In Statistical notation, it is mentioned as H0.
- Subsequently, the alternate hypothesis is introduced to hypothesis testing.
- Alternate Hypothesis testing is represented as Ha.
- The purpose of the alternate hypothesis is to check if there is sufficient evidence available to reject the null hypothesis.
- The subsequent steps include testing the hypothesis using the H0 and Ha to identify the rejection of the critical region and getting the conclusion.
- Example: For a Sales Use Case the Mean weekly sales amount is USD 10000 for a particular region is an assumption that can be validated using Hypothesis testing for a business to introduce new premium products to that particular region. The analyst needs to derive and apply the null and alternative hypothesis to process the hypothesis testing based upon the available data.
Conclusion
Statistical techniques are the basics of Machine learning algorithms. There are several tools and applications like MS Excel, R Language, Python scripting available to apply these techniques for statistical data analysis.